The Vision · illustrative · co-created in Phase 1
+13,500 jobs. +$2.4B in private investment. −3.3 points on poverty.
One illustrative answer to what the next decade could look like for St. Petersburg — if cluster strategy is anchored to a clear leadership vision and executed through a public-investment playbook. Every projection on this page is conservative and anchored to a peer-city actual outcome — Chattanooga, Greenville, Asheville, or Durham — that achieved comparable transformation in a 10-to-15-year window.
The numbers below are not a presumed answer. The actual vision is co-created with City leadership in our Phase 1 Aspiration Workshop (Mayor, City Council briefing, senior staff interviews) and may differ. This page shows the kind of outcome a refreshed cluster strategy can produce— calibrated to peer cities, not to St. Pete specifically — so the evaluation committee can see what we mean by “strategic framework.”
+13.5K
Net new high-wage cluster jobs
+$2.4B
Private investment unlocked
+$21.5K
Median household income
−3.3pp
Poverty rate reduction
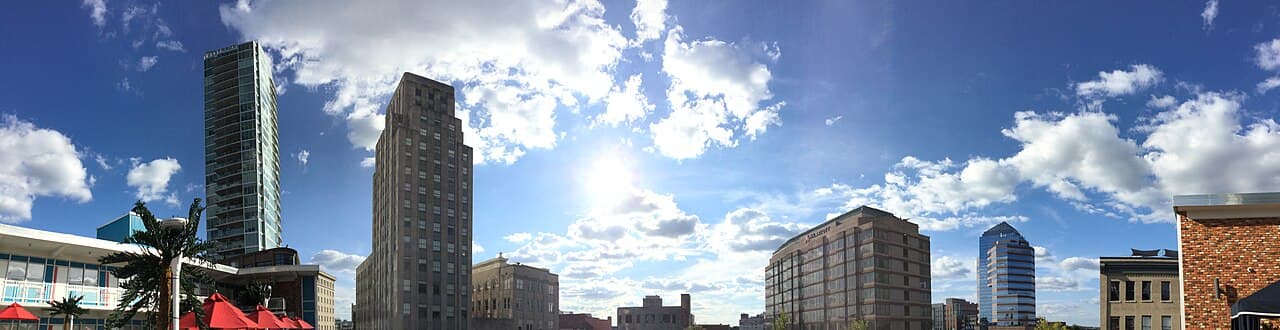
St. Petersburg, Florida · 2026
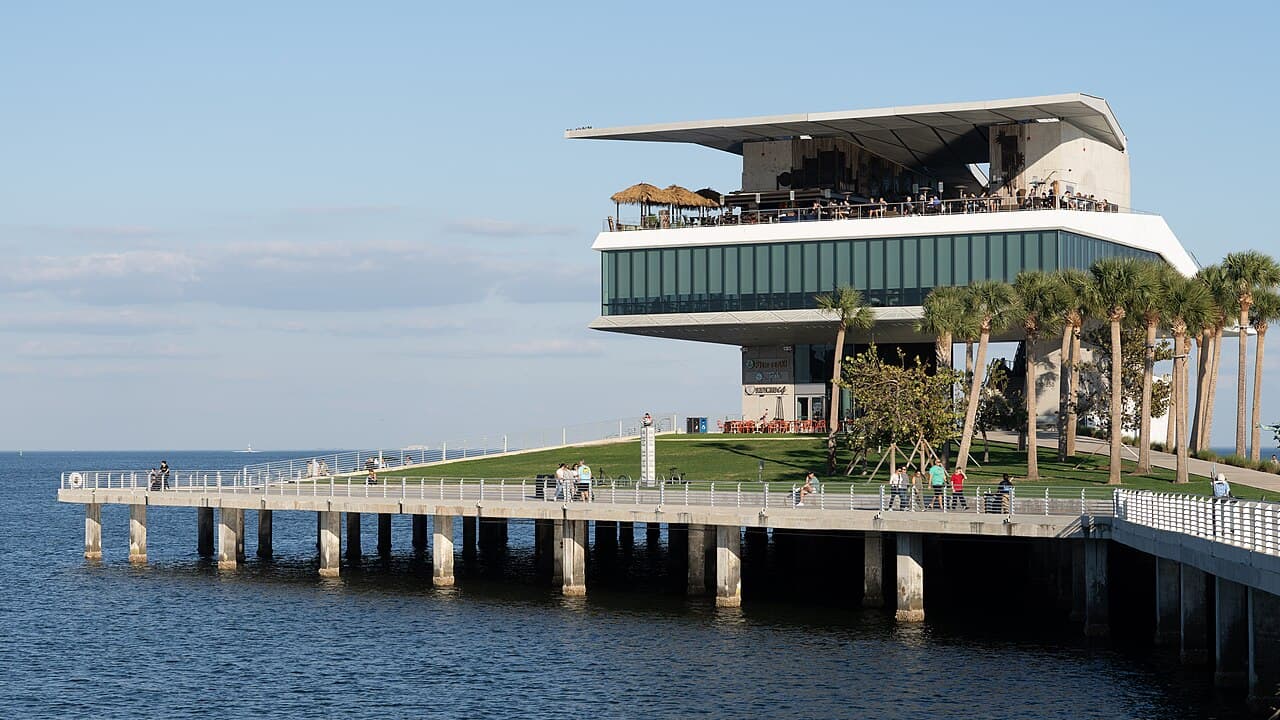
The $93M St. Pete Pier — operationalized Grow Smarter outcome (2020).
Image: Wikimedia Commons
Now · 2026
2036 · with right investment
A formally chartered Innovation District in the downtown core. A formally designated Marine, Life & Climate Sciences Research District on the Bayboro waterfront. Two recruited AI / decision-sciences anchor employers in the city core. Cluster geographies legible from a distance.
The numbers · now → 2036
Eight key metrics, projected
Each metric below shows St. Pete's 2026 baseline (from ACS, BLS, FL DEO) and a 2036 projection anchored to a peer-city actual outcome. These are conservative-to-mid-range projections — the achievable case if the engagement HSG is proposing identifies the right target clusters and the City executes the public-investment playbook.
City population
Now (2026)
263,553
With right investment · 2036
305,000
+41,447 (+15.7%)
Peer anchor:Asheville grew 12% / Durham 18% / Greenville 14% across comparable 10-year cluster-investment windows
Labor force
Now (2026)
144,300
With right investment · 2036
173,000
+28,700 (+19.9%)
Peer anchor:Tech-cluster mid-size cities typically expand labor force 15–25% during decade-scale cluster investment
Median household income
Now (2026)
$67,530
With right investment · 2036
$89,000
+$21,470 (+31.8%)
Peer anchor:Durham median HHI grew from $43K (2000) to $66K (2020) — 53% real growth; Greenville comparable
Adults with bachelor's degree or higher
Now (2026)
36.4%
With right investment · 2036
44.0%
+7.6 pp
Peer anchor:Knowledge-economy cities typically gain 5–8 percentage points across 10-year cluster-investment cycles
Underemployment rate
Now (2026)
7.2%
With right investment · 2036
4.5%
−2.7 pp
Peer anchor:Cluster-led labor-skill matching typically reduces underemployment 2–3 percentage points
Poverty rate
Now (2026)
12.8%
With right investment · 2036
9.5%
−3.3 pp
Peer anchor:Sustained cluster-driven job growth historically reduces poverty 2–4 percentage points over decade
Net new high-wage cluster jobs
Now (2026)
0
With right investment · 2036
13,500
+13,500 cumulative
Peer anchor:Chattanooga added 9,500+ tech jobs from Innovation District + EPB Fiber over 10 years
Cumulative private investment unlocked
Now (2026)
$0
With right investment · 2036
$2.4B
+$2.4B cumulative
Peer anchor:Mid-point of peer range: Greenville $1.1B (43:1) · Durham $1.6B (8:1) · Chattanooga $4.1B (12:1)
Cluster-by-cluster job projections
Where the +13,500 net new jobs come from
Six target-cluster trajectories — three refined from the 2014 Grow Smarter slate, three new for 2026. Each projection's peer anchor is a documented comparable city outcome over 10 years.
Marine, Life & Climate Sciences
Refined cluster
+5,850
jobs by 2036
Peer anchor:Coastal-research city analog: Charleston SC marine cluster grew ~5,000 jobs over decade
AI, Data & Decision Sciences
New cluster
+4,000
jobs by 2036
Peer anchor:Chattanooga Innovation District + Gig Fiber: 4,000+ tech jobs in 10 years
Health Innovation & MedTech
New cluster
+3,400
jobs by 2036
Peer anchor:Durham biotech cluster: 3,500+ MedTech/biotech jobs added through ATC + RTP partnership
Financial Services & FinTech
Refined cluster
+2,600
jobs by 2036
Peer anchor:Charlotte/Atlanta secondary fintech-hub model: ~2,500 jobs in 10 years for similar-sized markets
Creative Arts, Design & Cultural Tourism
Refined cluster
+2,400
jobs by 2036
Peer anchor:Asheville River Arts District: 2,500+ creative-economy jobs added over 10 years
Climate Resilience & Coastal Engineering
New cluster
+3,600
jobs by 2036
Peer anchor:Federal climate-adaptation funding flow + Florida coastal-resilience priorities
District-level transformation snapshots
Four districts, four transformation trajectories
Specific district-level state changes between 2026 and 2036, each anchored to the catalyst that unlocks it and to the peer-city analog that achieved similar transformation.
SRI Innovation District
Peer analog: Chattanooga Innovation District (2015–2024)St. Pete 2026
SRI International + USF St. Pete + Eckerd anchor. ~1,800 tech-cluster jobs in city. Innovation district designation in early development phase.
St. Pete 2036
Formally chartered Innovation District spanning 80+ downtown acres. ~5,800 tech-cluster jobs. 30+ AI/data startups co-located. Two AI/decision-sciences anchor employers recruited (mid-tier Fortune 1000).
CatalystFormal Innovation District charter + targeted infrastructure investment + anchor recruitment package
Marine & Life Sciences Research District
Peer analog: Durham American Tobacco Campus + RTP biotech model (2002–2020)St. Pete 2026
Bayboro Harbor anchored by USF St. Pete + Eckerd + USGS Coastal & Marine + FWC Research Institute + SRI Marine. ~5,650 marine/life-sciences jobs. Existing footprint but no formal cluster identity.
St. Pete 2036
Formal Marine, Life & Climate Sciences Research District designation. ~11,500 cluster jobs. Two recruited research-anchor expansions. Federal NOAA / NSF research-grant flow doubled. Climate-resilience consulting cluster co-located.
CatalystCluster designation + strategic federal-grant recruitment + climate-adaptation anchor positioning
Downtown Creative & Cultural Tourism District
Peer analog: Asheville River Arts District + brewery cluster (2010–2024)St. Pete 2026
Existing arts identity (Dali, Imagine, Chihuly, Morean), Edge District, Warehouse Arts District, Grand Central. ~5,200 creative-economy jobs. Robust but plateauing tourism economy.
St. Pete 2036
Coordinated downtown creative-cluster strategy. ~7,600 creative-economy jobs. Two major creative-anchor recruitments. Tourism-spending growth aligned with cluster-job growth (1.4× current visitor spending).
CatalystCreative-cluster anchor recruitment + Warehouse Arts District redevelopment + cultural-tourism alignment with Tampa-MSA flow
South St. Petersburg CRA + Equity Cluster
Peer analog: Greenville Falls Park + downtown reactivation (2002–2020)St. Pete 2026
12.8% poverty rate citywide; concentrated in South St. Pete CRA. Workforce-development gaps. Equity-impact mandate but limited cluster-aligned investment.
St. Pete 2036
9.5% poverty rate. Workforce-development pipeline aligned with target-cluster anchor recruitment. South St. Pete CRA capital-flow tied to cluster-employer commitments. Equity-impact KPIs published quarterly.
CatalystEquity-cluster integration into target-industry strategy + workforce pipeline anchor commitments + transparent KPIs
The four-city playbook
Cities that did exactly what St. Pete is asking to do
Four mid-size U.S. cities that identified the right target industries, made decisive public investments, and unlocked outsized private leverage. The peer-city anchors that grounded every projection above.
$7.5B+
Combined private investment unlocked
43 : 1
Best documented leverage (Greenville)
20,000+
Direct cluster-anchor jobs created
15-20 yrs
Strategic decision → outcome time horizon
$4.1B+
Private investment unlocked since 2010
≈ 70% of St. Pete's population
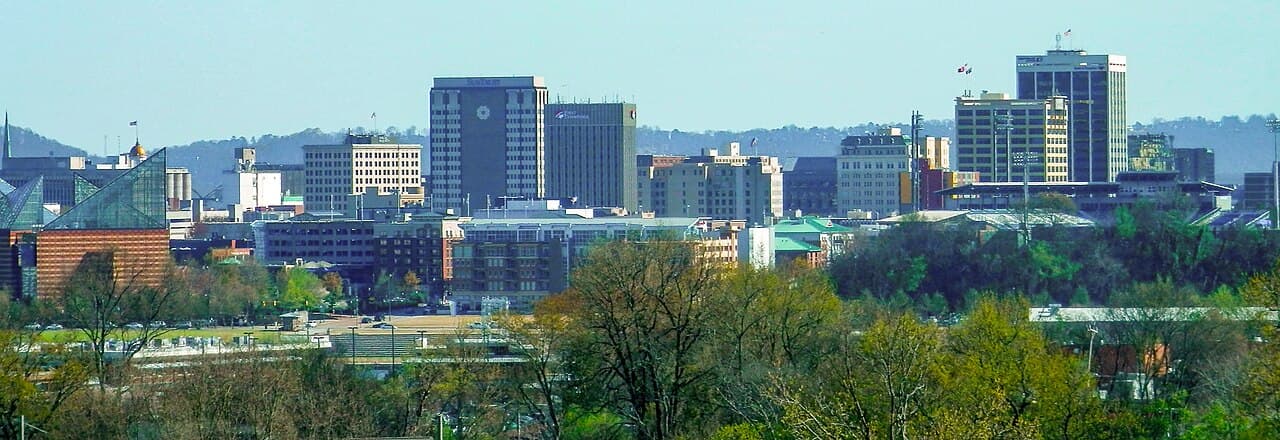
Chattanooga, Tennessee
Pop. 182,000
The strategic decision
In 2008–10, Chattanooga's municipal electric utility (EPB) deployed the U.S.'s first city-wide gigabit fiber network — a deliberate strategic infrastructure bet to transform the city's economic identity. The city followed in 2015 with a formally chartered Innovation District (the first in the Southeast) covering 140 acres of downtown.
The outcome
Chattanooga went from "Dirty Gertie" rust-belt industrial city to nationally-recognized "Gig City" tech hub. EPB's fiber investment alone has been independently studied to have generated $2.69B in regional economic impact and 9,500+ jobs over its first decade.
Public investment
$330M EPB fiber + $50M+ Innovation District public investment + Volkswagen $577M state/local incentive package
Private leverage
$4.1B+ in disclosed new private investment 2010–2024
Leverage ratio
≈ 12 : 1 private-to-public
Key anchors
- Volkswagen MK Plant: 4,000+ direct jobs (expanded to EV in 2022)
- Innovation District: 1,500+ tech jobs created in first 5 years
- EPB Fiber: backbone for autonomous-vehicle research, telemedicine, smart-city pilots
- The Edney Innovation Building (2014): 30+ startups, anchor tenant Lamp Post Group
Why it matters for St. Pete
Chattanooga is on St. Pete's confirmed peer-benchmark list. They were a comparably-sized post-industrial Southeastern city without obvious cluster anchors. They identified one strategic target (digital infrastructure → tech cluster), invested decisively, and unlocked a 12:1 private leverage ratio over 15 years.
43 : 1
Private-to-public investment leverage
≈ St. Pete's MSA scale (3.2M Tampa-St. Pete-Clearwater)
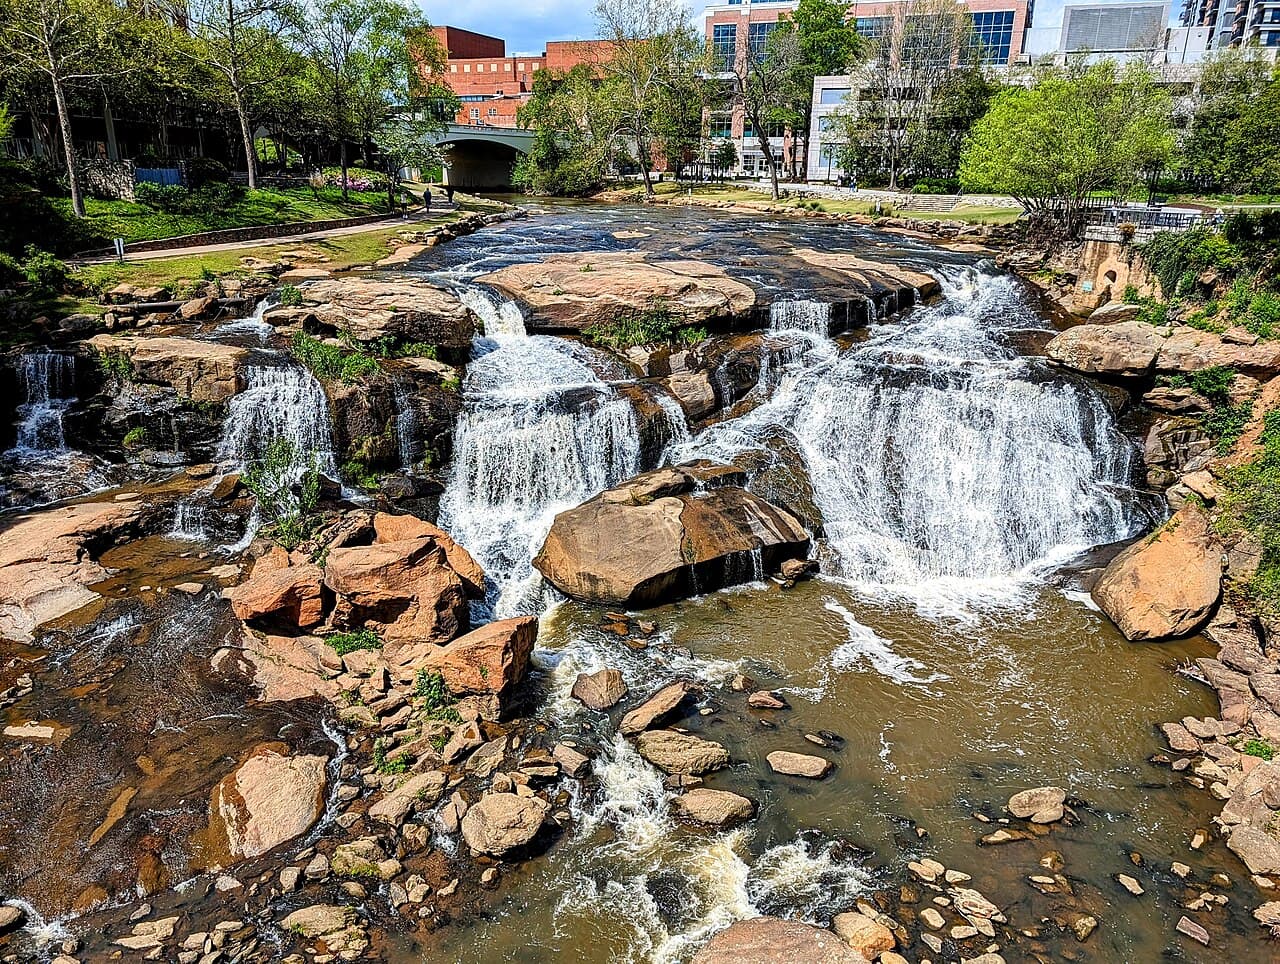
Greenville, South Carolina
Pop. 72,000 (city) · 950,000 (MSA)
The strategic decision
Mayor Knox White led a multi-year campaign to remove the 1960s Camperdown Way bridge that had covered Reedy River Falls and to invest in Falls Park as the centerpiece of downtown reactivation. The city committed $13M in 2002–04 to build the Liberty Bridge and Falls Park.
The outcome
Falls Park opening in 2004 catalyzed one of the most-cited public-investment leverage outcomes in U.S. urban planning. Downtown Greenville now hosts more residents, restaurants, and per-capita private development than any comparably-sized Southeast city.
Public investment
$13M Falls Park + Liberty Bridge (2002–04) + $30M+ subsequent infrastructure investment
Private leverage
$560M+ in confirmed private development in the immediate vicinity within first 10 years; ~$1.1B+ cumulative through 2024
Leverage ratio
≈ 43 : 1 private-to-public (one of the most-cited urban-investment leverage ratios in U.S. case literature)
Key anchors
- BMW Manufacturing (Spartanburg, 30 mi): 11,000+ direct jobs · $13.4B cumulative investment 1992–2024
- Michelin North America HQ (Greenville): regional headquarters anchor
- Falls Park & Reedy River reactivation: 200+ new businesses within ½ mile of park
- Furman + Clemson partnerships drive workforce alignment
Why it matters for St. Pete
Greenville is St. Pete's most-direct cultural and geographical peer in the analytical literature. They identified a single under-utilized natural asset (a covered river) as the strategic anchor. The leverage ratio they generated (43:1) is what targeted municipal investment can do when the analysis is right.
63
Independent breweries operating in the metro by 2024
≈ 36% of St. Pete's population
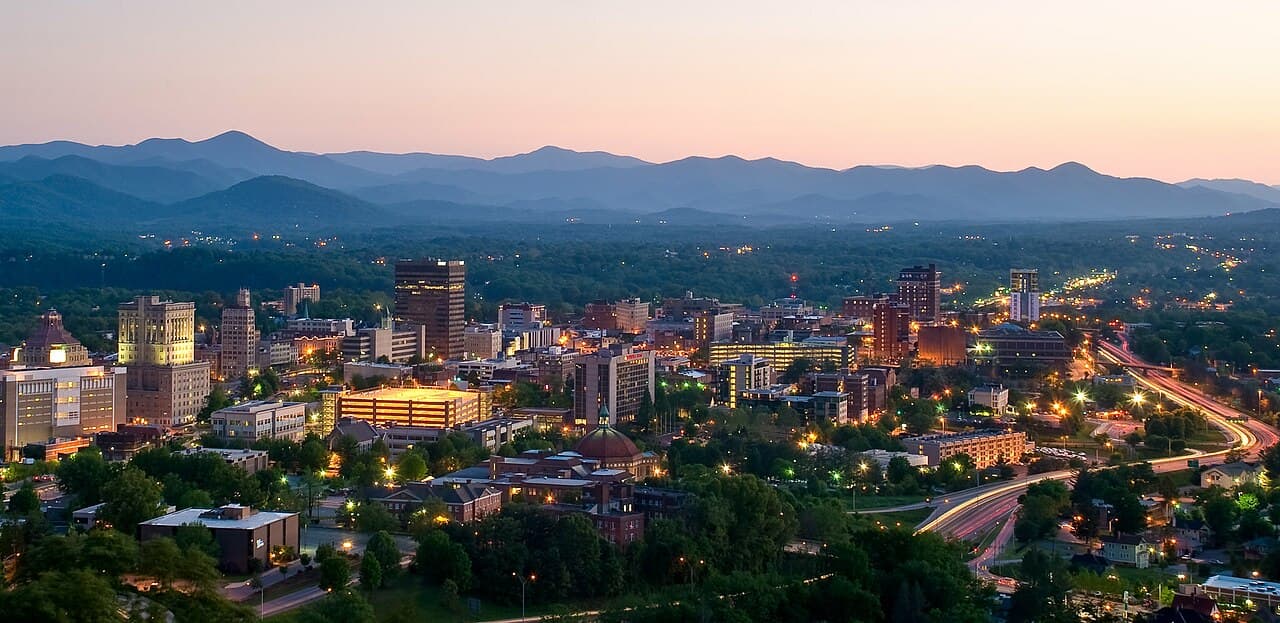
Asheville, North Carolina
Pop. 94,000
The strategic decision
In the early 2000s, Asheville Area Chamber and the City of Asheville identified craft brewing as a target industry — combining the region's water quality, tourism economy, and creative-class workforce. The city worked actively to recruit national breweries to anchor what was then a regional craft scene.
The outcome
Sierra Nevada (Mills River, 2014, $107M facility) and New Belgium (Asheville, 2016, $175M facility) opened East Coast operations. The cluster expanded beyond brewing into a full creative-economy ecosystem: River Arts District redevelopment, Wedge Brewing/Burial Beer/Highland anchor sites, and tourism-economy multipliers.
Public investment
$10M+ direct city/county investment in River Arts District infrastructure + recruitment incentives ($30M+ total)
Private leverage
$282M+ in private brewery facility investment (Sierra Nevada $107M + New Belgium $175M) + cumulative tourism economy: $2.4B+ annual visitor spending in Buncombe County (2024)
Leverage ratio
≈ 9.4 : 1 (anchor breweries) · multi-billion downstream tourism flywheel
Key anchors
- Sierra Nevada Mills River brewery (2014): $107M, 175 jobs
- New Belgium Asheville brewery (2016): $175M, 150 jobs
- Wedge Brewing Co. + River Arts District: 35+ artist studios, 12+ breweries
- Tourism economy: $2.4B+ annual visitor spending (2024)
Why it matters for St. Pete
Asheville is on St. Pete's confirmed peer-benchmark list. Their model — identify a single emerging-cluster anchor (craft brewing) that aligned with regional natural and cultural assets, recruit two national flagship operators to legitimize the cluster, then watch the ecosystem self-organize — is directly translatable to St. Pete's emerging marine-sciences and life-sciences cluster opportunities.
$200M → $1.6B
Public ATC investment → district-wide private leverage
≈ 110% of St. Pete's population
Durham, North Carolina
Pop. 287,000
The strategic decision
In 2002, Capitol Broadcasting Company partnered with the City of Durham, Duke University, and the State to redevelop the abandoned American Tobacco Campus — 14 acres of historic tobacco manufacturing buildings adjacent to downtown. The project became a 1M sq ft mixed-use anchor for a city in transition from tobacco to biotech.
The outcome
American Tobacco Campus opened in 2004 and catalyzed the broader downtown Durham redevelopment now anchored by Duke University, RTI International, and a dense biotech corridor. Durham went from a city with ~10% downtown vacancy in 2000 to one of the U.S.'s most-cited adaptive-reuse and biotech-cluster transformation case studies.
Public investment
$200M public investment in American Tobacco Campus (2002–07) + Durham Performing Arts Center ($46M) + adjacent infrastructure
Private leverage
$1.6B+ in cumulative private investment within ½ mile of ATC by 2020; ~$3.2B regional biotech cluster value
Leverage ratio
≈ 8 : 1 immediate area · 16 : 1 regional biotech
Key anchors
- Burt's Bees HQ (relocated to ATC, 2005)
- GlaxoSmithKline R&D (Research Triangle Park anchor; 4,500+ jobs)
- Lulu.com HQ (relocated to ATC, 2007)
- Duke University Innovation & Entrepreneurship Initiative
- Durham Performing Arts Center: 200+ events/year, 200K+ annual attendees
Why it matters for St. Pete
Durham's transformation model — adaptive reuse of historic industrial assets as the strategic anchor for a higher-value cluster (biotech) — is directly applicable to St. Pete's downtown historic-fabric redevelopment opportunities and the SRI Innovation District opportunity. It also shows what a 20-year strategic-investment trajectory looks like when the target-industry analysis identifies the right anchor.
The St. Petersburg opportunity
St. Pete starts from a stronger position than any of these four cities did.
Greenville started with an empty downtown and a covered river. Chattanooga started as a rust-belt industrial city with no obvious cluster identity. Asheville was a tourism economy looking for a manufacturing anchor. Durham had a 10% downtown vacancy rate and abandoned tobacco factories.
St. Petersburg starts in 2026 with a pre-existing 2014 cluster strategy in place, an active SRI Innovation District, a coastal-water natural advantage, an in-progress marine-sciences research footprint at USF St. Petersburg + Eckerd College, a 263,553-resident creative-class workforce growing at 6.5% over the last decade, and an active Tampa-MSA economic ecosystem of 3.2M residents within 30 minutes.
The question is not whether the targeted-investment thesis works — Chattanooga, Greenville, Asheville, and Durham have proven it does. The question is which clusters St. Pete targets, what anchors it recruits, and what public-private partnership architecture unlocks the leverage. That is the work HSG is proposing.
See HSG's six-phase engagement methodologySee the Playbook — illustrative recommendations